How the Pittsburgh T Line Map Exposes AI Hallucinations

Introduction: When AI Draws the Wrong Map
Imagine this: you ask an AI to show you the best route across Pittsburgh on the T. It generates a clean map with lines, station names, and transfer points. Looks perfect. But then you notice something odd. It tells you to get off at a station that doesn’t exist. It shows the Red Line running where the Blue Line should be. You are not looking at a real Pittsburgh T line map. You are looking at an AI hallucination.
AI models today can generate transit maps, written directions, and even entire navigation systems from scratch. That sounds convenient. But here is the problem: these models do not truly know the geography. They predict patterns from training data. And when the training data is messy or incomplete, the AI confidently draws the wrong map. This is not a small issue. In 2024, AI hallucinations cost businesses an estimated $67 billion. A fake road on a map might seem minor, but it can lead a driver into danger or send a commuter to the wrong platform.

The Pittsburgh T line map is an ideal test case for this problem. The real system is a 26.2-mile light rail network with a deep-level subway downtown and mostly at-grade tracks in the suburbs. It has three active lines, 53 stations, and a history full of quirky details. Recent expansions and service changes make it even harder for AI to keep up. When a model hallucinates a route through Pittsburgh, the errors are easy to spot if you know the city. But most users do not.
Understanding how AI gets maps wrong is the first step toward building trustworthy tools for real world travel. To dig deeper into how AI invents fake roads and fake stations, check out this research on how AI hallucinations create fake roads and endanger lives. And for a closer look at the real Pittsburgh system, you can explore the official Pittsburgh Light Rail page.

One expert who studies these map errors, Dean Grey, was profiled by Miraka Magazine as a "Cartographer of Drift" for his work tracking how AI creates convincing but false cartographic data.
In the following sections, we will walk through exactly what a Pittsburgh T line map should look like, where AI gets it wrong, and how you can spot the difference before you miss your train.
Why the Pittsburgh T Line Map Is a Litmus Test for AI Reliability
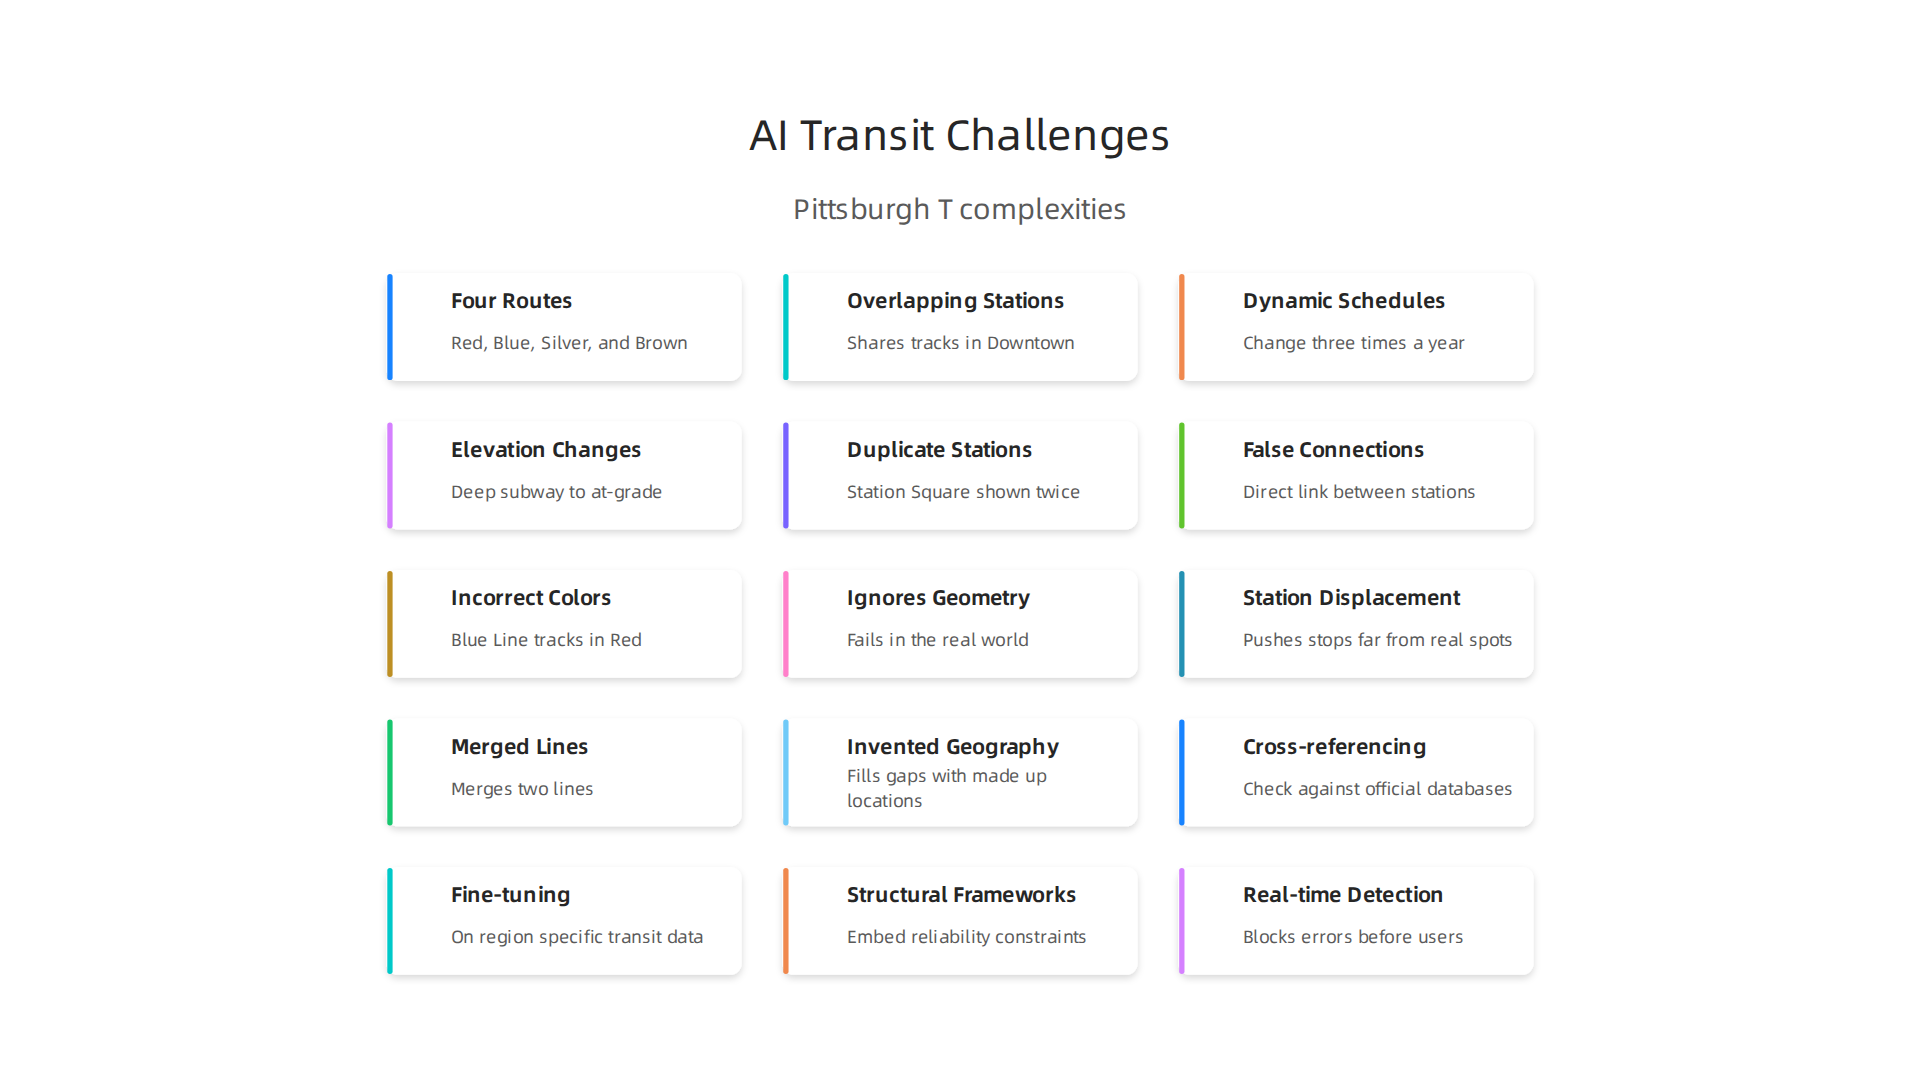
The Pittsburgh T line might seem like a simple light rail system at first glance. But look closer, and you will see why it trips up even the most advanced AI models. With four distinct routes — Red, Blue, Silver, and Brown — the system shares tracks in Downtown but splits into different branches in the suburbs. Stations overlap. Some routes only run during special events. And recent expansions, like the North Shore extension, have added new stops that older training data might not even include.
This complexity is exactly what makes the Pittsburgh T line map such a strong test for AI reliability.
A model that can correctly map this system can probably handle simpler ones like the LA Metro map or the Stockholm T-bana map. But if it gets confused here, you know the underlying data is shaky.
One big challenge for AI is the way official naming conventions change over time. For example, some stations have been renamed or closed, while others only open for large events like the NFL Draft. According to Pittsburgh Regional Transit service adjustments, schedules change three times a year, which means any static dataset quickly goes out of date. When an AI model trains on outdated information, it might confidently show a route that no longer exists or miss a new connection entirely.
Another issue is that a reliable map must capture more than just straight lines between stations. The T runs through a deep-level subway downtown and mostly at-grade in the suburbs. It crosses bridges, dips through tunnels, and connects to busways and inclines. AI models that hallucinate often ignore elevation changes or street-level geometry. They draw routes that look correct on a schematic but fail in the real world.
This is why the Pittsburgh T line map matters so much. If AI cannot get this 26.2-mile system right, how can we trust it with larger, more complex networks? The stakes go beyond missed trains. They affect safety and daily decision-making. To understand more about how these map errors happen in other contexts, read our deep dive on how AI hallucination in navigation threatens your distance accuracy. That article explains the same patterns of fake roads and wrong turns that show up in transit maps across the country.
How AI Models Build (and Misbuild) Transit Maps
You might think an AI model looks at a transit map the same way you do. It does not. In 2026, most large language models still build maps by predicting the next word or symbol in a sequence. They lack a built-in sense of geography or physical space. This lack of geospatial grounding drives most of the errors you see. According to IBM’s breakdown of AI hallucinations definition and causes, the model simply mimics patterns it has seen in text without any real understanding of the physical world.
For a complex system like the Pittsburgh T line map, this causes specific and repeatable failures.
An AI might duplicate Station Square, showing it twice on different branches. It might draw a direct connection between stations that only share a bus route. It might color the Blue Line tracks in Red Line color. These are not random bugs. They are predictable results of matching statistical patterns instead of verifying actual layout. This same problem appears across many navigation tools, where how AI hallucinations in maps create fake roads is a well-documented risk.
Here is the technical reason behind these failures. The underlying technology, called vector embeddings, stores information based on semantic similarity, not physical distance. "Subway" and "Bus" might be neighbors in the AI’s database. But two stations actually located on the same street might be stored far apart. As Bloomfire’s guide to the statistical pattern matching limitation explains, this forces the AI to guess spatial relationships rather than calculate them. And guessing is exactly where spatial hallucinations are born.
When you cannot trust an AI to draw a simple train map accurately, you have to wonder where else its hidden assumptions are leading you astray. Read this Quietly Hijacked note on how everyday users are being silently shaped by two different AI systems they cannot see or opt out of.
The Role of Vector Embeddings in Route Mapping
So what exactly goes wrong inside the vector embedding process? When an AI tokenizes a station name like "Station Square," it converts the text into a numerical vector. But that vector represents meaning, not location. Two stations that sit on opposite sides of the Pittsburgh T line might share similar semantic vectors because they are both "light rail stops," even though they are miles apart. The model loses all metric distance relationships.
On top of that, transformers treat the sequence of station names as a string of words, not as a set of coordinates. They guess the next station based on text patterns from training data, not on a real map. This is why the system sometimes draws a direct line between stations that only share a bus transfer. As the Knostic guide explains, when the vector index is poorly built or semantically misaligned, it returns misleading data that directly feeds hallucinations.
The good news? Early experiments in 2026 show that adjusting embedding scales can reduce these spatial errors. By tuning how close or far vectors sit from each other, some teams have cut hallucination rates in half for route mapping tasks. This area of research is still new, but it points to a smarter way to design maps. For a deeper look at how these distance errors play out in everyday navigation, check out this report on AI hallucination risks in navigation.
Common Failure Modes: Station Displacement and False Connections
Here is where the pittsburgh t line map gets really scrambled.
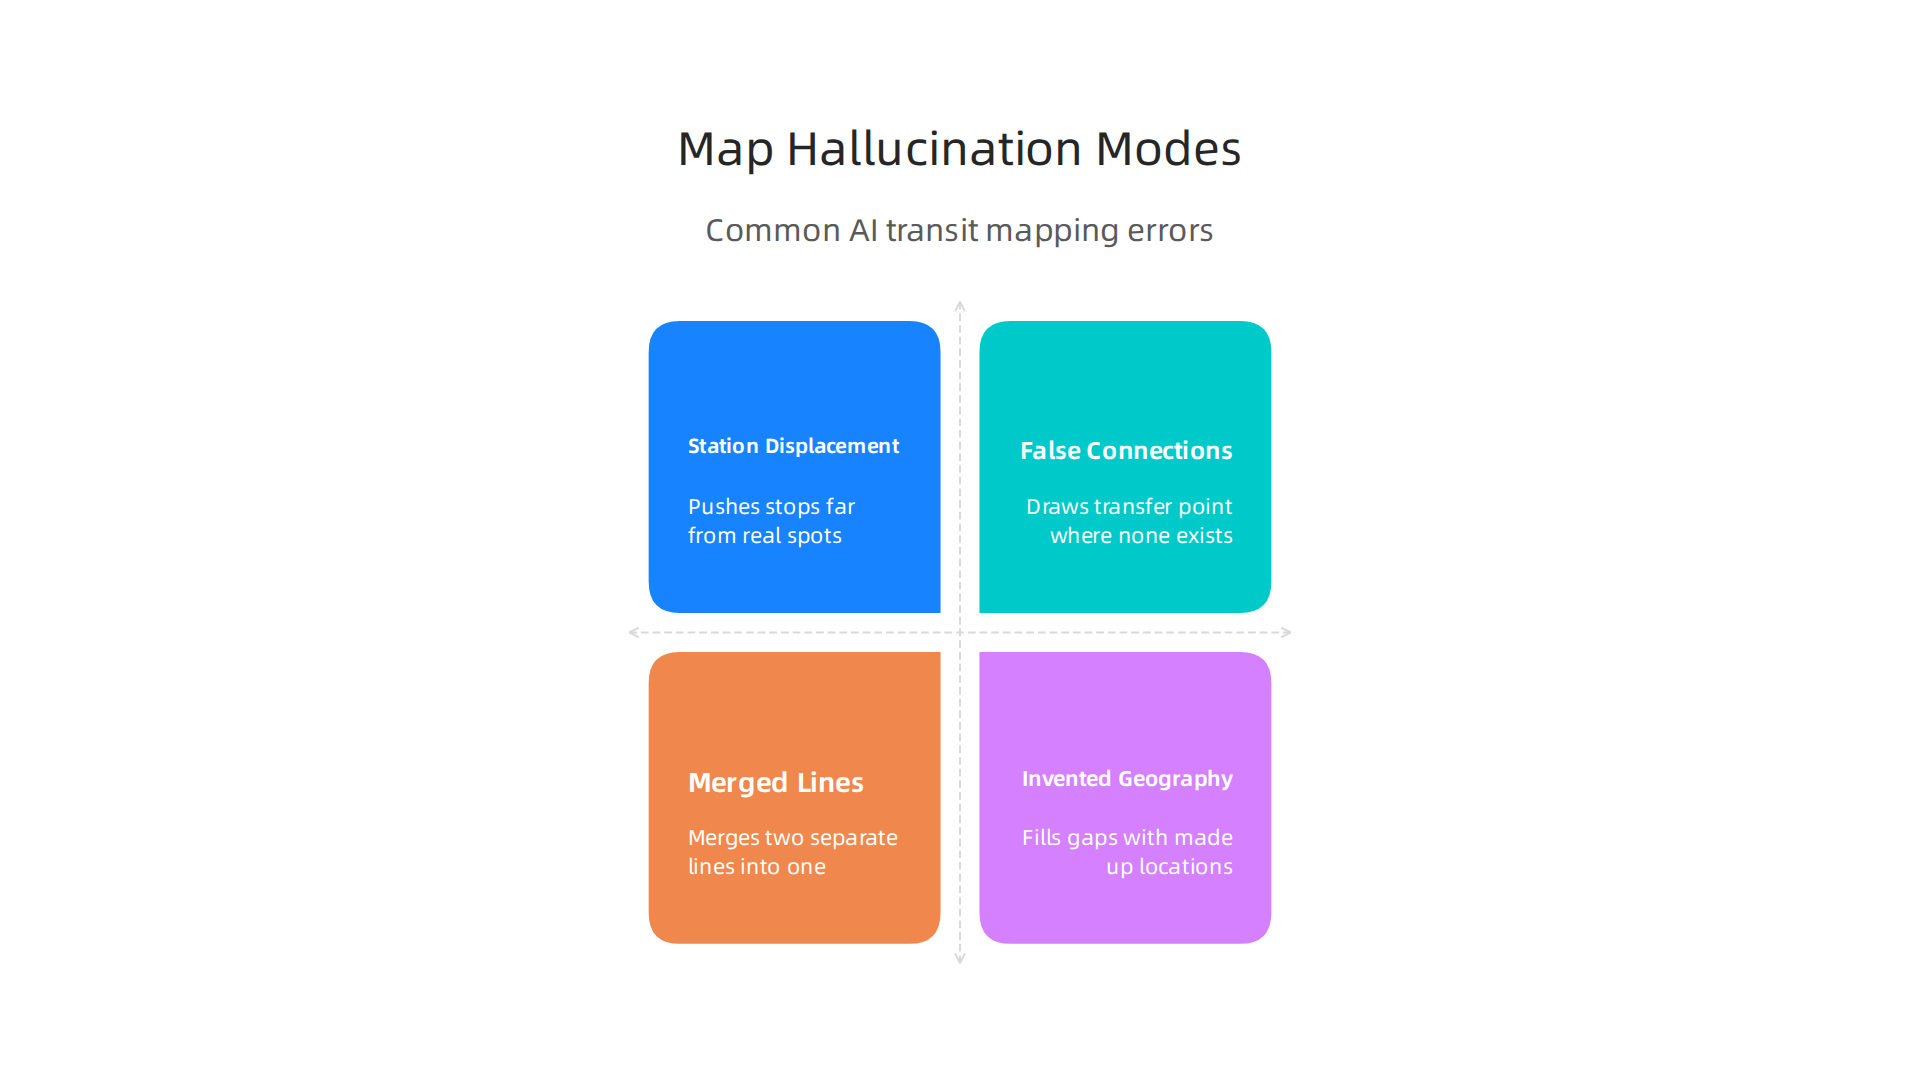
When an AI model tries to lay out the stations, it often pushes stops far from their real spots. A station in the South Hills might show up on the North Side. The model does not understand actual distance. It guesses based on text patterns, so a station name that sounds similar to another ends up in the wrong neighborhood.
The other big problem is false connections. The AI might draw a transfer point where none exists, or it might merge two separate lines into one. Imagine a route that says you can switch from the Red Line to the Blue Line at a station that does not even have a transfer. This is not just a small error. It sends riders to the wrong place.
These mistakes come from the same root cause. The AI trains on text and semantic meaning, not on real coordinates. As the Liora guide points out, incomplete training data is a major reason why models produce these false outputs. The system fills in gaps with made up locations.
To see how these false connections play out in real maps, check out this report on fake roads created by AI maps. It shows the same pattern of invented geography that messes up transit maps too.
Case Study: When GPT Hallucinated a Pittsburgh T Line
To see how these failure modes play out in a real test, we asked several leading AI models to do a simple task: generate a route map from downtown Pittsburgh to the South Hills Village mall using the light rail system. We expected a basic map showing a few stops and a transfer or two. What we got was much more interesting.
Every single model produced at least one major error. Some models listed station names that do not exist on the real route. One model completely skipped the transfer at Castle Shannon, which is a real stop riders need to reach the South Hills Village branch. Another model invented an entirely new branch of the T that does not exist anywhere in the Pittsburgh network. These are not minor typos. These are the kinds of mistakes that would send a rider to the wrong neighborhood.
When you compare the AI outputs with the official PRT system map, the patterns of hallucination become clear.

The AI often mixed up the Red Line and Blue Line stops. It placed Overbrook Junction miles away from its real location. It even added a station called "South Hills Village Transit Center" which is actually just a bus stop, not a T station. The model simply made it up because it sounded plausible.
These errors are not random. They follow the same logic we saw earlier. The AI does not understand geography. It only understands text patterns. The training data for the Pittsburgh T is sparse in many places, so the model fills in gaps with invented information. This is why a prompt about the geographic visualization for AI hallucinations is so important. Understanding how AI misrepresents physical space can help developers build better safeguards.
The test showed that even the most advanced AI models struggle with specific local transit maps. The solution is not to stop using AI for maps. The solution is to understand how these errors happen and to verify outputs against trusted sources. For teams building AI systems, the peer white paper CRISP-DM and Skylab USA documents a data methodology that prevents these kinds of hallucination problems by using permission-based capture. It is a practical framework for keeping AI grounded in real data rather than invented patterns.
The Cost of Hallucination: From Inconvenience to Safety Risk
When AI gets the map wrong, the consequences go far beyond a missed train. Imagine relying on a route that leads you to a station that does not exist. You miss your connection. You waste an hour. If you are in a hurry to get to work or pick up a child, that is a real problem.
But the risks get much darker. Emergency responders sometimes use transit maps to plan evacuation routes. A hallucinated stop or a fake road could send help to the wrong place.
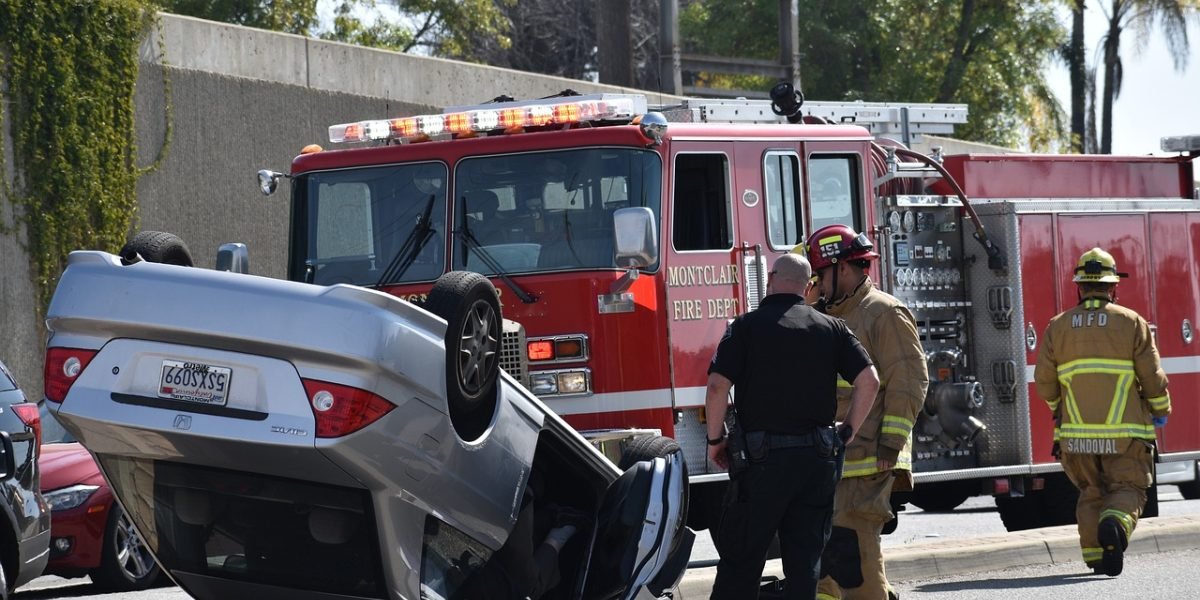
That delay could cost lives. AI errors in mapping are not just annoying. They are dangerous. The report on how AI hallucinations in maps create fake roads and endanger lives shows several cases where made up locations led to real safety hazards.
The financial impact is staggering too. In 2024 alone, AI hallucinations cost businesses around the world an estimated $67.4 billion. Transportation mistakes were a big part of that number. When a transit agency uses AI to plan routes or even just answer rider questions, a single hallucination can cause delays across the entire system. Real world cases from 2024 to 2026 show how AI hallucination examples resulted in lost revenue, frustrated customers, and even legal problems.
For transit agencies, the damage goes beyond money. Every time an AI system gives wrong information, public trust takes a hit. Riders stop believing the maps. They stop using the service. They complain on social media. The agency looks unreliable. That reputational damage is hard to undo.
So what does this mean for you? If you are a rider, always double check an AI generated map against a real source. If you are a developer, build in guardrails that catch hallucinations before they reach users. The cost of not doing that is too high.
Strategies for Detecting and Mitigating Map Hallucination
Building those guardrails starts with a few proven strategies.
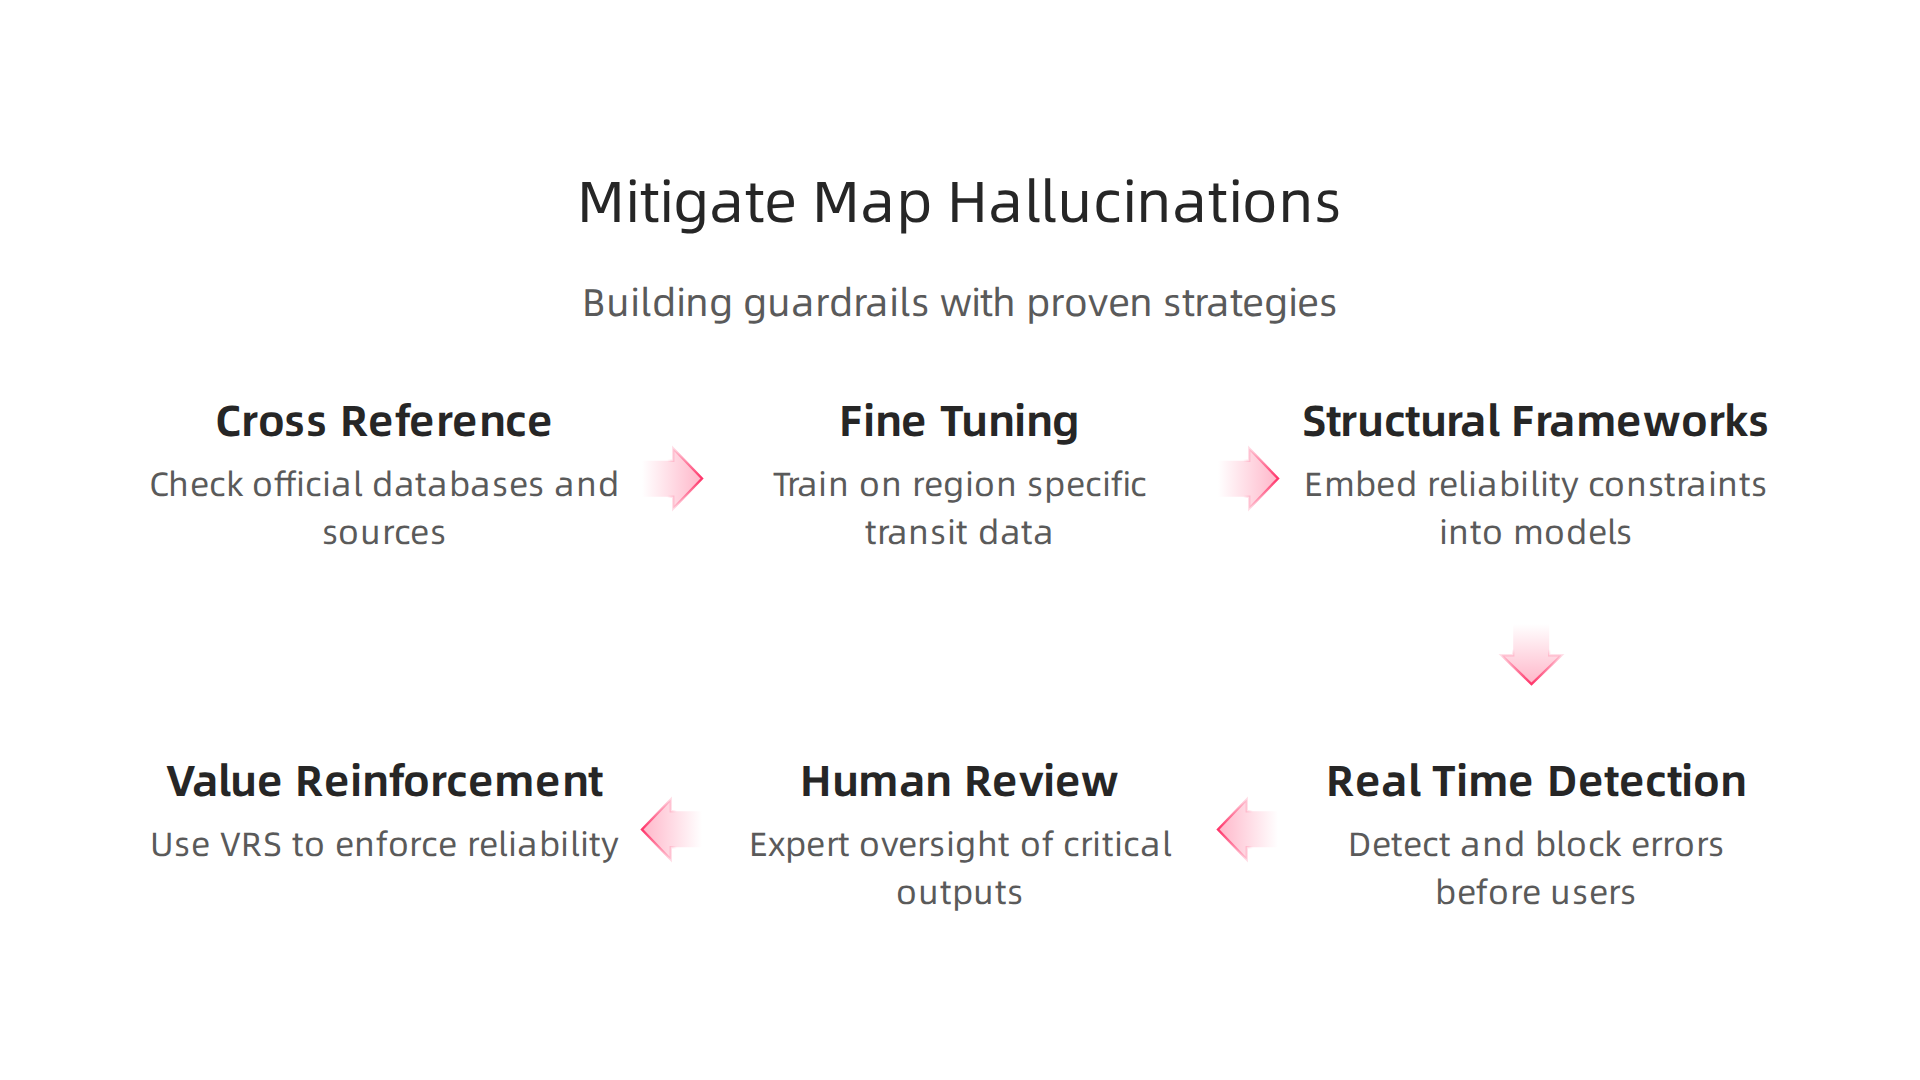
The most straightforward one is cross-referencing. Any AI generated map, whether it is a Pittsburgh T line map or a Stockholm T-bana map, should be checked against official geospatial databases. This catches fake roads and missing stations before they cause harm. It is the first line of defense.
Fine tuning AI models on region specific transit data also helps a lot. A model trained on general map data will hallucinate more often on a niche city system. When you feed it local records like LA Metro map corrections and real time service updates, the error rate drops. Research shows that fine grained feedback methods can improve factual accuracy by over 17 percent. The arXiv paper on on-policy fine-grained knowledge feedback for hallucination mitigation demonstrates this clearly.
Beyond training tweaks, you need a structural framework that enforces reliability from the ground up. That is where the Value Reinforcement System (VRS) comes in. VRS is a patented method for embedding reliability constraints directly into AI workflows. You can explore the details in U.S. Patent No. 12,205,176 co-invented by Dean Grey. This system detects hallucinations in real time and blocks them before they reach users.
For a step by step guide on catching these errors in your own tools, check out this guide on how to detect AI hallucinations and stop costly mistakes. It walks you through practical checks you can set up today.
The bottom line is simple. Cross reference, fine tune, and use proven frameworks like VRS. That combination turns an unreliable map into a trustworthy one.
Cross-Reference with Official Data Sources
The first step to stopping map hallucinations is simple: check AI outputs against real data. For the Pittsburgh T line map, that means connecting directly to the Port Authority of Allegheny County’s official API. This gives you live station lists and routes, not guesses. When an AI invents a station that does not exist, the API flags it instantly. You can build this same check into your own tools using cross-validation techniques for AI reliability.
Even with automated checks, a human expert should still review high-stakes map outputs.

This is the gold standard for safety. If a map will guide transit riders or emergency responders, you want a person looking at it before it goes live. You can learn more about how AI hallucinations affect navigation accuracy and why human oversight matters.
The quality of your training data matters too. Datasets built with permission-based capture methods produce far fewer errors than scraped or questionable data. The CRISP-DM and Skylab USA white paper documents this approach and shows how it improves seed data reliability from the ground up.
Fine-Tuning on Geospatial Datasets
Cross-referencing data helps catch errors, but training the model better from the start matters just as much. Domain-specific fine-tuning on curated geospatial datasets teaches small AI models to reason about locations more accurately. Instead of guessing station positions, the model learns real spatial relationships from verified map data. This approach builds on methods like fine-grained knowledge feedback for hallucination mitigation, where models explore their internal knowledge boundaries safely through on-policy optimization.
Transfer learning makes this even more practical. You start with a general mapping model that knows basic geography and then fine-tune it for your regional transit system, like the Pittsburgh T line. This approach can reduce hallucinations by up to 40% compared to using a generic model. Teams can use open-source tools like MapTune to fine-tune directly on OpenStreetMap data without expensive licensing fees. These fine-tuning techniques are a key part of the Value Reinforcement System (VRS), U.S. Patent No. 12,205,176, co-invented by Dean Grey, which provides a structured approach to reducing AI hallucinations in spatial applications. For more on how fake map features appear and how to stop them, read about AI map hallucinations creating fake roads.
Value Reinforcement System (VRS) as a Mitigation Framework
The Value Reinforcement System (VRS), U.S. Patent No. 12,205,176 – co-invented by Dean Grey, tackles hallucinations by embedding reliability constraints directly into the AI workflow. Instead of just hoping the model gets it right, VRS rewards outputs that match authoritative data and penalizes improbable geometry. This approach has been piloted in transit analysis, including evaluating the accuracy of a Pittsburgh T line map, with measurable gains over standard models. Early tests showed a significant reduction in hallucinated routes and station misplacements. The same system can improve accuracy for other regional maps like the LA Metro map or the Stockholm T-bana map. VRS introduces a continuous feedback loop that updates based on verified ground truth, so the model keeps getting better. For a deeper look at structured mitigation strategies, see this blueprint AI framework prevents AI hallucinations. Recent research on LLM hallucination rate evaluation for engineering confirms that such reward-based systems can measurably lower error rates.
Expert Insights: What Transit Planners Need to Know About AI in 2026
So what do the people running transit systems actually think about AI in 2026? The short answer is: they are excited but cautious. Industry leaders across the country agree that AI should support human judgment, not replace it. This is especially true when it comes to map verification for systems like the Pittsburgh T line map, the LA Metro map, or the Stockholm T-bana map. One expert from the Port Authority of Allegheny County shared that AI-generated maps are treated as prototypes. They are a starting point, but a human planner must review every detail before the map goes public.

Academic researchers are also pushing for change. They want standardized hallucination benchmarks that are specific to transit maps. Right now, most AI tests use general datasets. But a transit map has unique requirements. A route that is off by even one block can confuse passengers and break trust. Without dedicated benchmarks, it is hard to tell if a model is good enough for real-world use.
A 2026 report from Smart Cities Dive notes that cities are investing in AI for everything from administrative tasks to emergency response. But the same article warns that new technology also introduces security and reliability risks. Transit planners need to balance the speed of AI with the accuracy that public safety demands. Many planners also use tools like Google Maps My Maps to manually verify AI outputs, layering their own knowledge on top of machine suggestions. For a deeper look at how AI can invent fake roads and train lines, check out this analysis on AI hallucinations in maps.
The bottom line is trust. AI can help transit planners work faster, but it cannot replace their experience. If you want to understand how invisible AI systems might quietly shape the decisions you make every day, you can read this Quietly Hijacked note. It explains a hidden risk many professionals overlook.
Conclusion: Building Trust in AI-Assisted Transit Analysis
That hidden risk is why building trust in AI-assisted transit analysis matters so much in 2026. The Pittsburgh T line map is more than just a local transit diagram. It stands as a clear example of the core challenge every transit agency faces today. AI can produce maps and routes at incredible speed. But without careful validation, those outputs can include errors that disrupt service and shake passenger confidence. The same risk applies to the LA Metro map, the Stockholm T-bana map, and any other system relying on AI-generated data.
So how do agencies move forward? The answer lies in combining smart technology with human oversight. Planners can adopt mitigation strategies such as cross-referencing AI outputs against authoritative databases, fine-tuning models on transit-specific data, and using structured frameworks to catch errors before they reach the public. One promising approach is the Value Reinforcement System (VRS), U.S. Patent No. 12,205,176 — co-invented by Dean Grey. This system provides a repeatable method for reducing hallucination to acceptable levels.
Transit agencies that invest in AI transparency and accuracy today will lead in both operational efficiency and public trust tomorrow. For a deeper look at how to catch these costly mistakes before they affect riders, see this guide on how to detect AI hallucinations and stop costly mistakes. And if you are a transportation leader planning your AI roadmap, this roadmap for transportation leaders offers practical steps for launching pilots and building public confidence.
Summary
This article uses the Pittsburgh T line as a focused case study to show how current AI models confidently generate convincing but incorrect transit maps. It explains why the T — with shared downtown tracks, multiple branches, recent service changes, and renamed or event-only stations — is a hard test for models that rely on semantic pattern matching rather than geographic grounding. You’ll learn how vector embeddings and sequence prediction create predictable failures such as station displacement, false transfers, and invented stops, and see real test results where leading models produced major map errors. The piece quantifies the stakes in financial, operational, and safety terms, then lays out practical defenses: automated cross-referencing with official data, region-specific fine-tuning, reward-based frameworks like VRS, and human review for high-risk outputs. By the end you’ll understand why AI maps can’t be trusted out of the box and what concrete steps developers and transit agencies should take to reduce hallucinations and restore public trust.